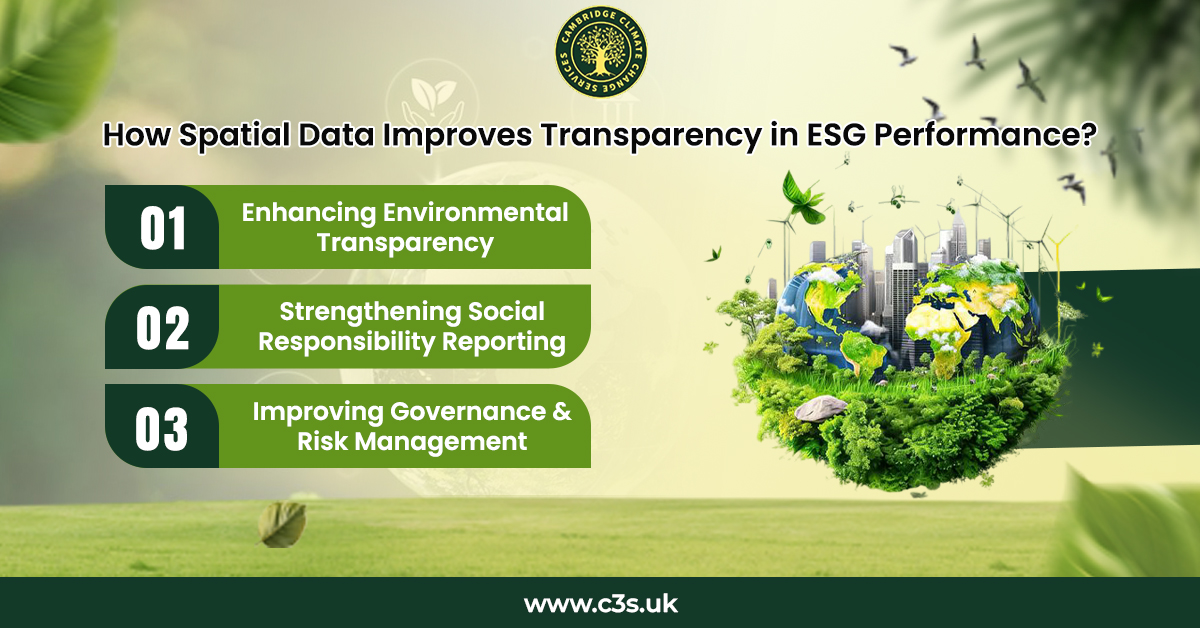
How Spatial Data Improves Transparency in ESG Performance?
Today, an organization’s performance in Environmental, Social, and Governance (ESG) has become mission-critical for gauging corporate responsibility and sustainability over time. More than ever, investors, regulators, and the public are clamoring for clarity on how organizations report their ESG activities.
Typical self-reported data, spreadsheets, and disconnected systems are ambiguous and lend themselves to green washing. It is in the area of enabling ESG transparency that spatial data is reinventing itself. Companies can reach out to ESG strategy, and reporting experts at C3S to know more.
What Is Spatial Data in the ESG Context?
Spatial data subsumes satellite images, GPS points, drone surveys, GIS data, and remote-sensing data. The application of ESG principles to spatial data enables organizations to track the real locations of their operations, suppliers, emissions, resources, and social activities.
For instance, rather than claiming a company has reduced deforestation, spatial data would show before-and-after satellite images of forest cover with and without operations.
Instead of saying ‘reduced water consumption,’ geospatial mapping could highlight areas of water stress and changes in water use over time. This site-based approach brings ESG reporting much closer to objective reality.
Enhancing Environmental Transparency
As per ESG strategy, and reporting experts at C3S, companies can track carbon emissions by facility location, identify environmental hotspots, and monitor compliance with environmental regulations using spatial data. Satellite images can promptly detect illegal mining, deforestation, oil spills, or air pollution in near real time.
This helps reduce reliance on manual inspection, which is time-consuming, thereby increasing stakeholders’ responsibility.
For example, satellite imagery over months or years can be used by agricultural and forestry firms to validate sustainable land-use practices. Energy companies are using thermal imaging satellites to monitor potential methane leaks from pipelines and oil rigs. These tools will help reduce environmental degradation and provide a transparent record for regulators and investors.
Strengthening Social Responsibility Reporting
The measurement of social aspects-that is, labor conditions, the effects of corporate footprints on communities, and human rights-is often most difficult. But spatial data exposes and validates these areas.
Mapping enables a company to determine if supplier factories are situated in geographical areas that are considered high-risk zones-potential hot spots for labor violations, child labor, or unsafe conditions in which to work. Likewise, spatial analysis indicates whether the operations indeed have implications for vulnerable communities, indigenous lands, or populations sensitive to environmental changes.
For instance, mining and infrastructure companies may map the distance of their projects from villages, schools, water sources, and hospitals. This ensures that development activities do not displace communities or pollute essential resources.
Improving Governance and Risk Management
Good governance fundamentally rests on visibility, supervision, and risk awareness. Spatial data provides leadership teams and boards with a clear understanding of operational risks by geography.
Companies can map areas of political instability, climate risk zones, flood-prone regions, or areas subject to high regulatory scrutiny. All of these enable organizations to prepare for the anticipated ESG-related risks before they develop into expensive scandals or compliance failures.
Suppose a business is sourcing materials from varied countries. Such companies could use geospatial tools, and help of ESG strategy, and reporting experts at C3S to identify further areas prone to corruption, conflict over minerals, or environmental violations.
This, in turn, will facilitate improved supplier selection, ethical sourcing, and compliance with international regulations, such as the EU’s Corporate Sustainability Reporting Directive (CSRD).
Reducing Green washing Through Verifiable Data
Green washing is one of the biggest challenges in ESG. It is misleading or exaggerated sustainability claims made by companies. Spatial data would visually and geographically support such claims, thereby reducing their risk considerably.
Mapping ESG data with satellite imagery and geographic coordinates makes it almost impossible to manipulate. This way, claims can be independently verified by investors, regulators, and the general public, thereby giving them much more confidence in corporate disclosures.
End Note
As ESG regulations become more stringent worldwide, corporations will need more than just narrative reports and spreadsheets. There is a rise in spatial data becoming the backbone of next-gen ESG reporting, adding accuracy, accountability, and real-world validation to sustainability efforts.
By relating ESG metrics to actual locations, organizations can honestly assess how they impact the planet and society, thereby earning their trust. In today’s world, where transparency is no longer a choice but an obligation, earning the public’s trust is paramount to organizational efforts. In that case, reaching out to ESG strategy, and reporting experts at C3S is highly recommended.